The Human Fingerprint on Earth’s Water Cycle
Human activities have become intertwined with how water is distributed across the continents. A new study brings their effects into sharper focus.
Key points
- Focus: Human activities have become intertwined with how water is distributed across the continents
- Detail: Institutional origin: separate announcement from evidence
- Editorial reading: institutional release, useful as a primary source but not independent validation.
Human activities have become intertwined with how water is distributed across the continents. A new study brings their effects into sharper focus. The institutional report frames the development in practical terms and ties it to the broader mission or observing effort.
The significance lies in Earth science becomes stronger when local observations can be placed inside a broader physical pattern that spans time and geography. The planet operates as a coupled system in which atmospheric, oceanic, cryospheric and solid-Earth processes interact across timescales from days to millions of years. A measurement that captures one variable at one location and one moment has limited interpretive value until it is embedded in the longer series and wider spatial coverage that allow natural variability to be separated from forced change. Downloads Terrestrial water storage trend map JPEG (615.77 KB) References & Resources NASA Earth Observatory (2018, May 23) Twin Satellites Map 14 Years of Freshwater Changes. Elephant Butte Reservoir Runs Low 3 min read Drought in the Rio Grande basin contributed to New Mexico’s largest reservoir dwindling to its lowest level in decades.
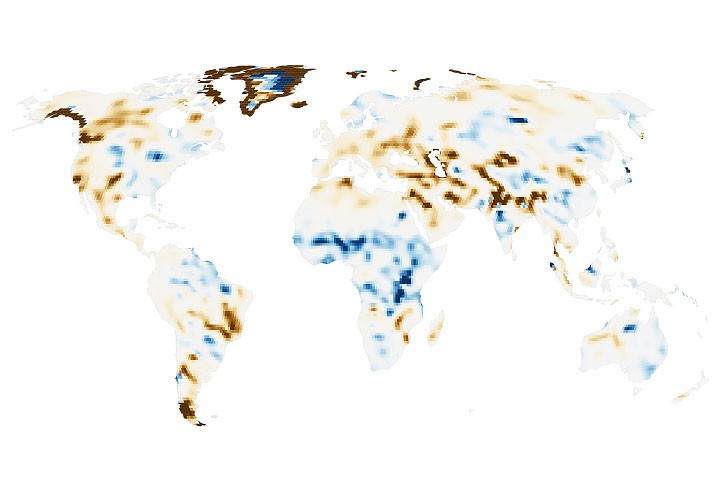
Humans are exerting increasing influence over how water moves through lakes, rivers, soil, and the subsurface, and a new NASA study shows where those effects are greatest. Using more than two decades of satellite measurements of subtle changes in Earth’s gravity, the researchers sharpened the picture of how, and why, terrestrial water storage has.
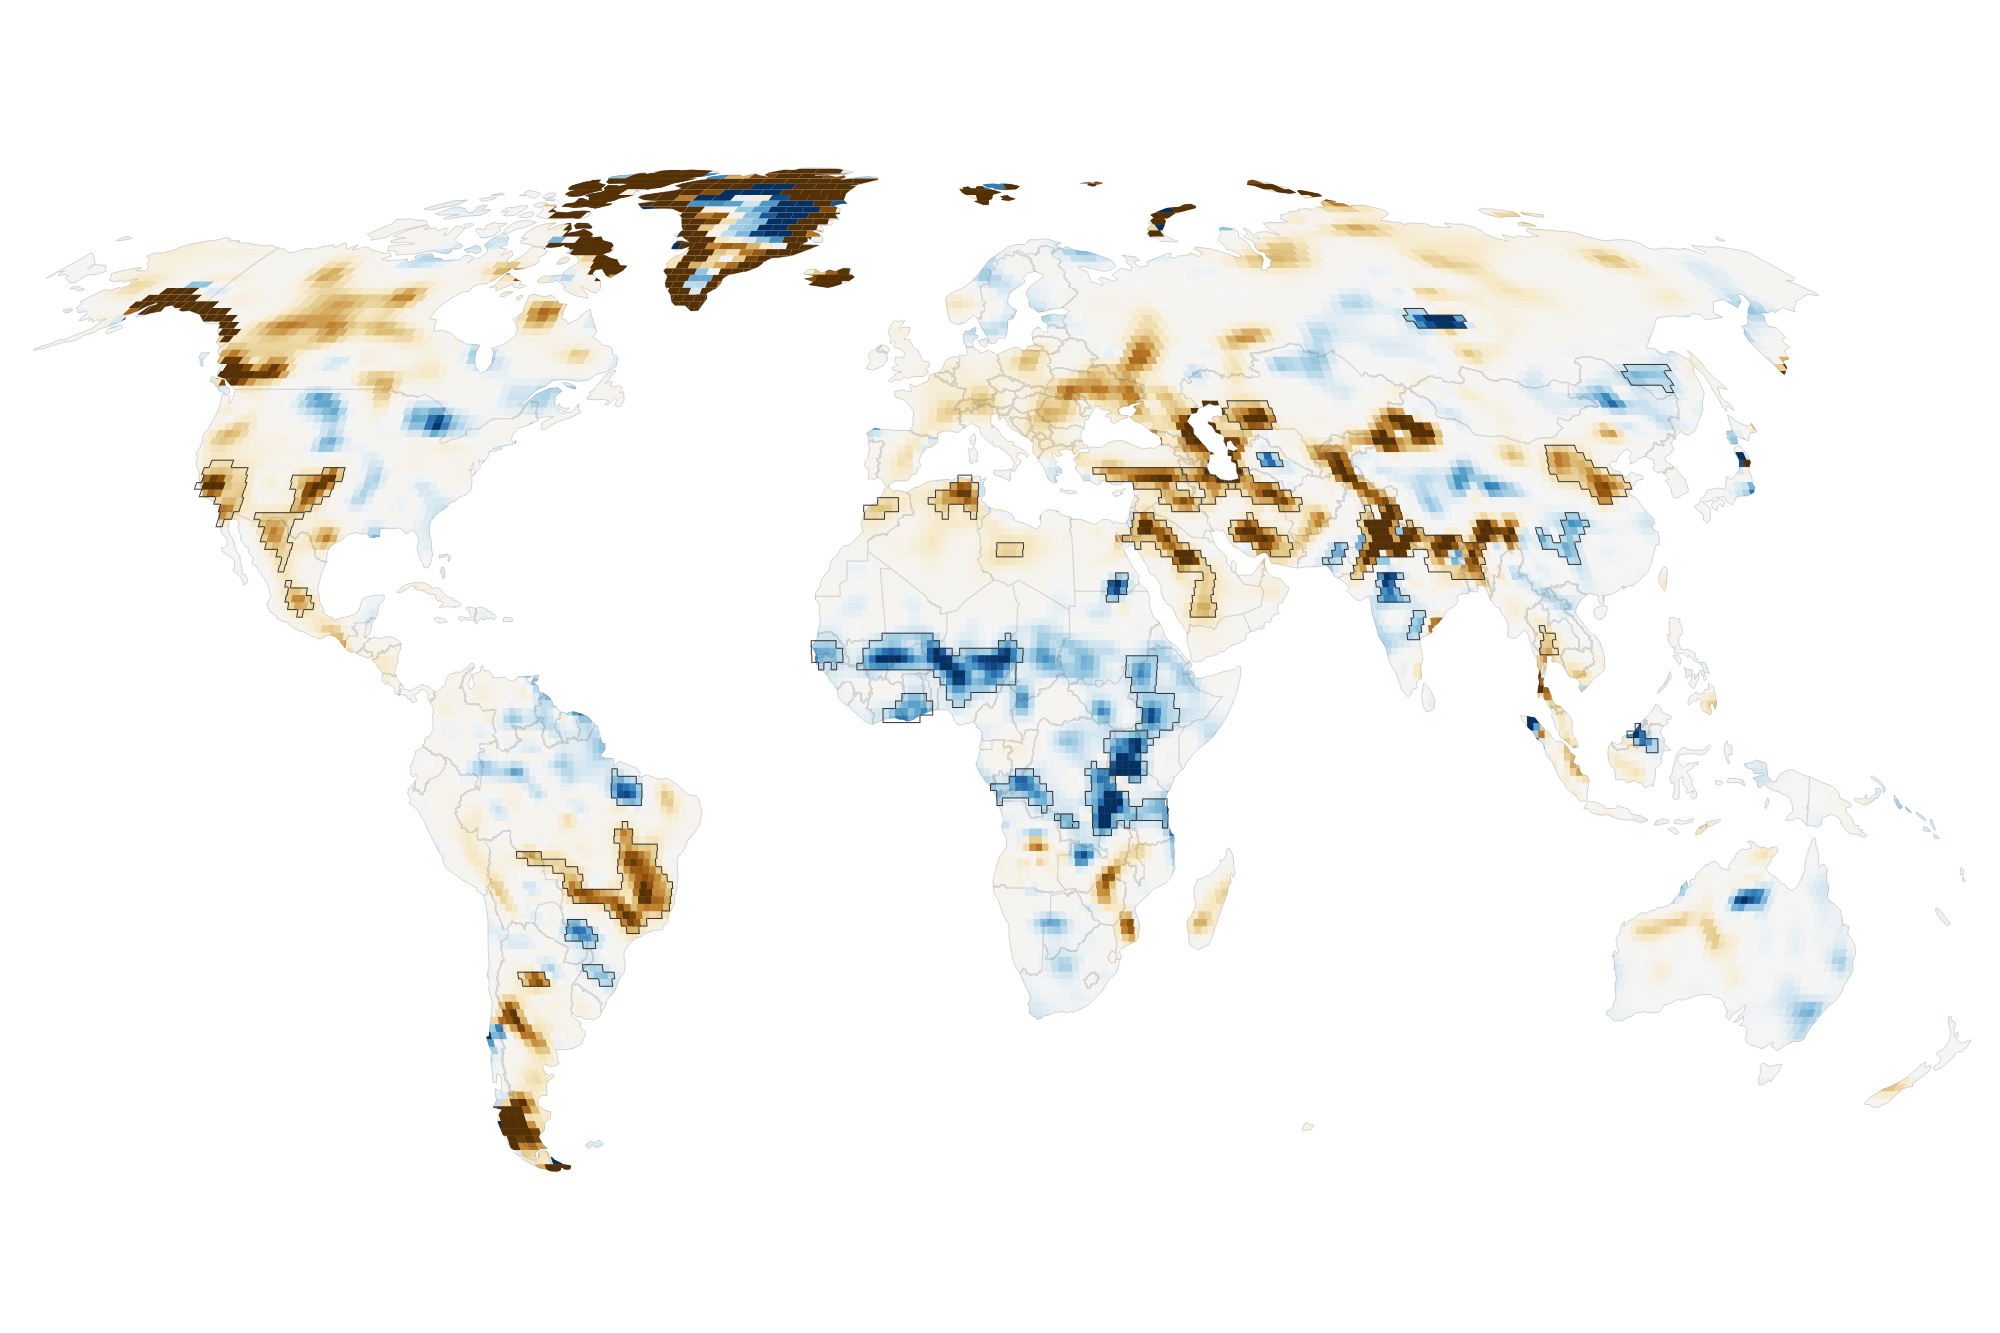
This map encapsulates their findings, depicting changes in terrestrial water storage from April 2002 to November 2025. Beyond the influence of climate variability, the scientists identified 40 regions where the changes also aligned with human activities such as irrigation, reservoir impoundment.
By combining all of those passes, the researchers could map long-term water trends with five to 10 times more spatial detail than previous analyses. The improved spatial resolution uncovered some human impacts that had not been previously detected, said Matthew Rodell, deputy director of Earth Sciences for Hydrosphere.
The broader interest lies in linking the observation to climatic, geophysical or environmental dynamics that extend well beyond the immediate event or location. Earth science is unusual in that its most important questions operate on timescales that no single research career can observe directly, making the archival record, whether in ice, sediment, rock or satellite data, as important as any new measurement. Results that can be embedded in that record, and that either confirm or challenge the patterns it reveals, carry disproportionate scientific weight.
Consistent with previous findings, retreating Himalayan glaciers accounted for only 15 percent of the decline there. In the new analysis, the Boguchany Reservoir on Russia’s Angara River, the second-largest reservoir filled in the 21st century, produced the strongest water storage trend in.
Because the account originates with NASA News Releases, it functions best as a primary institutional report that is close to the data and operations, not as independent scientific validation. Institutional communications are produced by organizations with legitimate interests in presenting their work in a favorable light, which does not make them unreliable but does make them partial. Details that complicate the narrative, including instrument limitations, unexpected failures and results below projections, tend to be minimized relative to progress messages. Technical documentation and peer-reviewed publications, where they exist, provide the complementary layer that institutional releases cannot substitute.
The next step is to place the result inside longer time series and to compare it with independent instruments and independent sites. Earth system observations gain most of their interpretive power from network density and temporal depth, not from any single measurement however precise. Model simulations that assimilate the new data will help clarify whether the observation fits comfortably within known natural variability or represents a shift that existing models do not reproduce.

Original source: NASA News Releases