Gravity Waves From Super Typhoon Sinlaku
Satellites observed striking upper-atmosphere phenomena generated by an intensifying tropical cyclone.
Key points
- Focus: Satellites observed striking upper-atmosphere phenomena generated by an intensifying tropical cyclone
- Detail: Institutional origin: separate announcement from evidence
- Editorial reading: institutional release, useful as a primary source but not independent validation.
Satellites observed striking upper-atmosphere phenomena generated by an intensifying tropical cyclone. The institutional report frames the development in practical terms and ties it to the broader mission or observing effort.
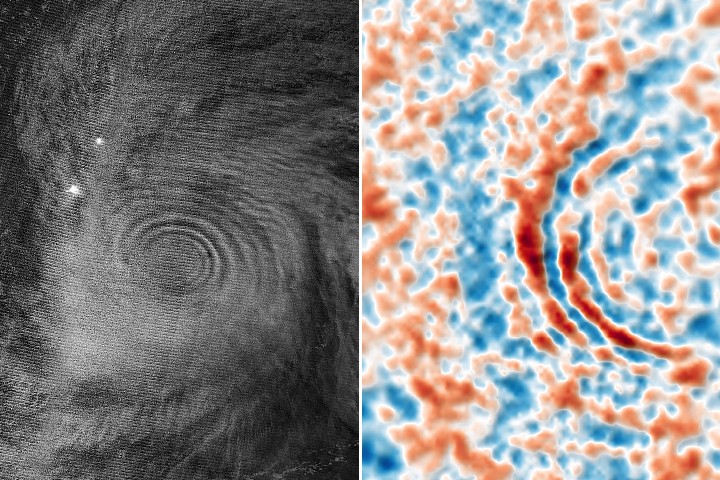
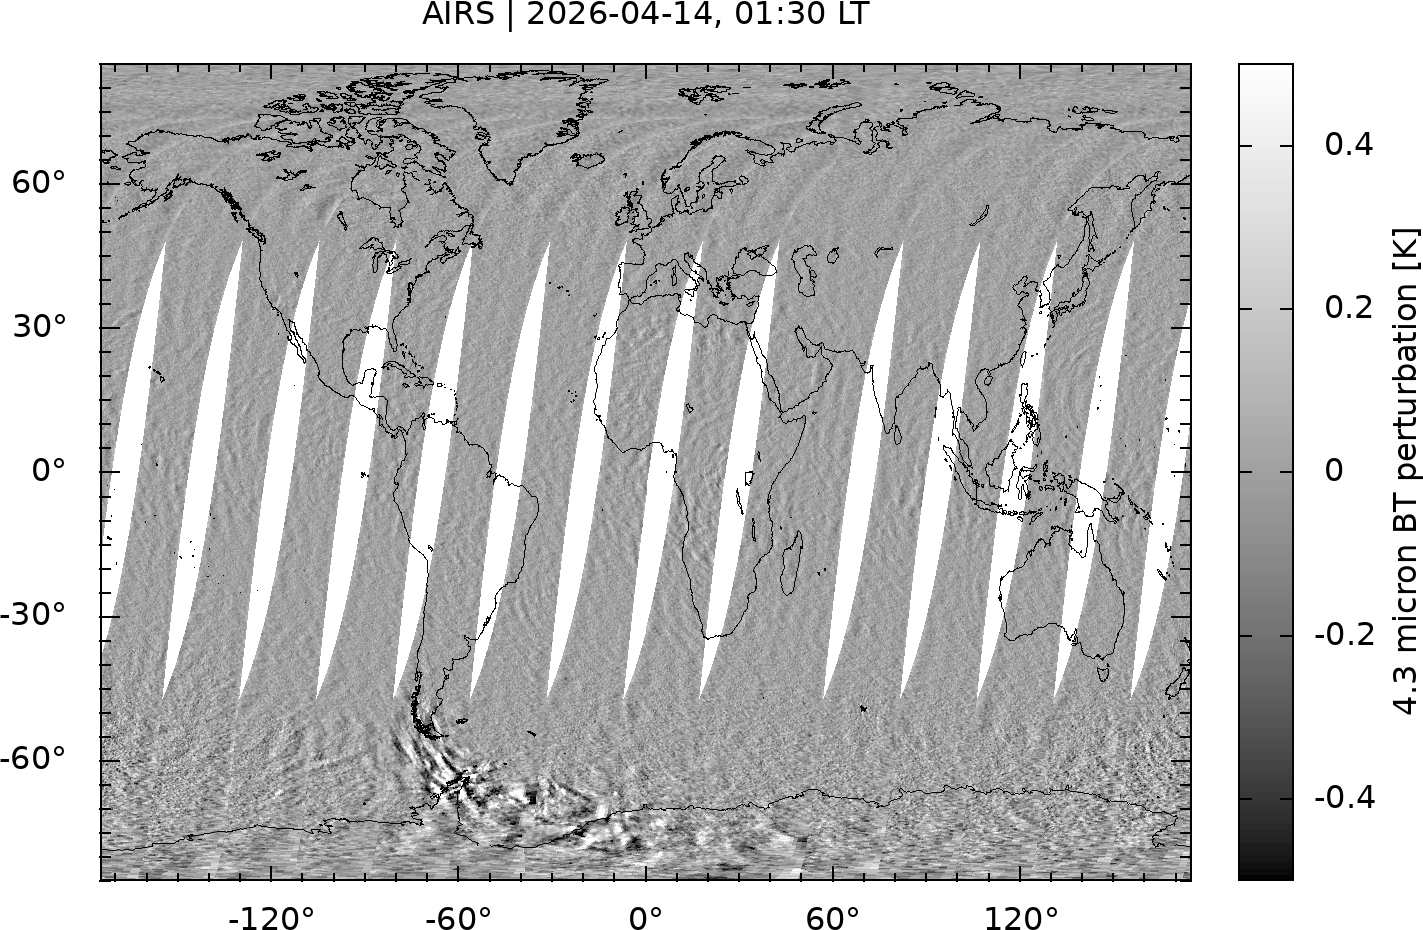
It matters because Earth science becomes stronger when local observations can be placed inside a broader physical pattern that spans time and geography. The planet operates as a coupled system in which atmospheric, oceanic, cryospheric and solid-Earth processes interact across timescales from days to millions of years. A measurement that captures one variable at one location and one moment has limited interpretive value until it is embedded in the longer series and wider spatial coverage that allow natural variability to be separated from forced change. Thermal energy from gravity waves produced by Super Typhoon Sinlaku was detected in the stratosphere by the AIRS (Atmospheric Infrared Sounder) instrument on NASA’s Aqua satellite. NASA Earth Observatory/Michala Garrison Sinlaku’s gravity waves, in addition to appearing high in the atmosphere via airglow, were observed lower in the atmosphere by the AIRS.
Stay up-to-date with the latest content from NASA as we explore the universe and discover more about our home planet. Earth Observatory Image of the Day NASA’s Earth Observatory brings you the Earth, every day, with in-depth stories and stunning imagery.
NASA Earth Observatory/Michala Garrison In mid-April 2026, Super Typhoon Sinlaku churned across the North Pacific Ocean and brought heavy rain and flooding to the Mariana Islands. The nighttime image above, acquired with the VIIRS (Visible Infrared Imaging Radiometer Suite) on the NOAA-20 satellite, shows atmospheric gravity waves radiating from the typhoon.
Indeed, in the 24 hours prior to the acquisition of the image above, Sinlaku had strengthened from a category 2 to a category 5 storm. Winds in the upper atmosphere can dissipate the waves before they reach such high altitudes, Alexander explained, but relatively light stratospheric winds at the storm’s latitude.
The broader interest lies in linking the observation to climatic, geophysical or environmental dynamics that extend well beyond the immediate event or location. Earth science is unusual in that its most important questions operate on timescales that no single research career can observe directly, making the archival record, whether in ice, sediment, rock or satellite data, as important as any new measurement. Results that can be embedded in that record, and that either confirm or challenge the patterns it reveals, carry disproportionate scientific weight.
The Moon was about 25 percent illuminated on April 12, so some light reflected off clouds in the troposphere was visible, but not enough to overpower the signal from the airglow. Sinlaku’s gravity waves, in addition to appearing high in the atmosphere via airglow, were observed lower in the atmosphere by the AIRS (Atmospheric Infrared Sounder) instrument.
Because the account originates with NASA News Releases, it functions best as a primary institutional report that is close to the data and operations, not as independent scientific validation. Institutional communications are produced by organizations with legitimate interests in presenting their work in a favorable light, which does not make them unreliable but does make them partial. Details that complicate the narrative, including instrument limitations, unexpected failures and results below projections, tend to be minimized relative to progress messages. Technical documentation and peer-reviewed publications, where they exist, provide the complementary layer that institutional releases cannot substitute.
The next step is to place the result inside longer time series and to compare it with independent instruments and independent sites. Earth system observations gain most of their interpretive power from network density and temporal depth, not from any single measurement however precise. Model simulations that assimilate the new data will help clarify whether the observation fits comfortably within known natural variability or represents a shift that existing models do not reproduce.


Original source: NASA News Releases