NASA Satellites Observe Historic 2026 El Niño
A phenomenon rarer than a solar eclipse and more powerful than any single storm system is unfolding this fall, and NASA is tracking it closely.
Pontos-chave
- Em foco: A phenomenon rarer than a solar eclipse and more powerful than any single storm system is unfolding this fall, and NASA is tracking it closely
- Detalhe: Origem institucional: distinguir anúncio de evidência
- Leitura editorial: release institucional, útil como fonte primária, mas não como validação independente.
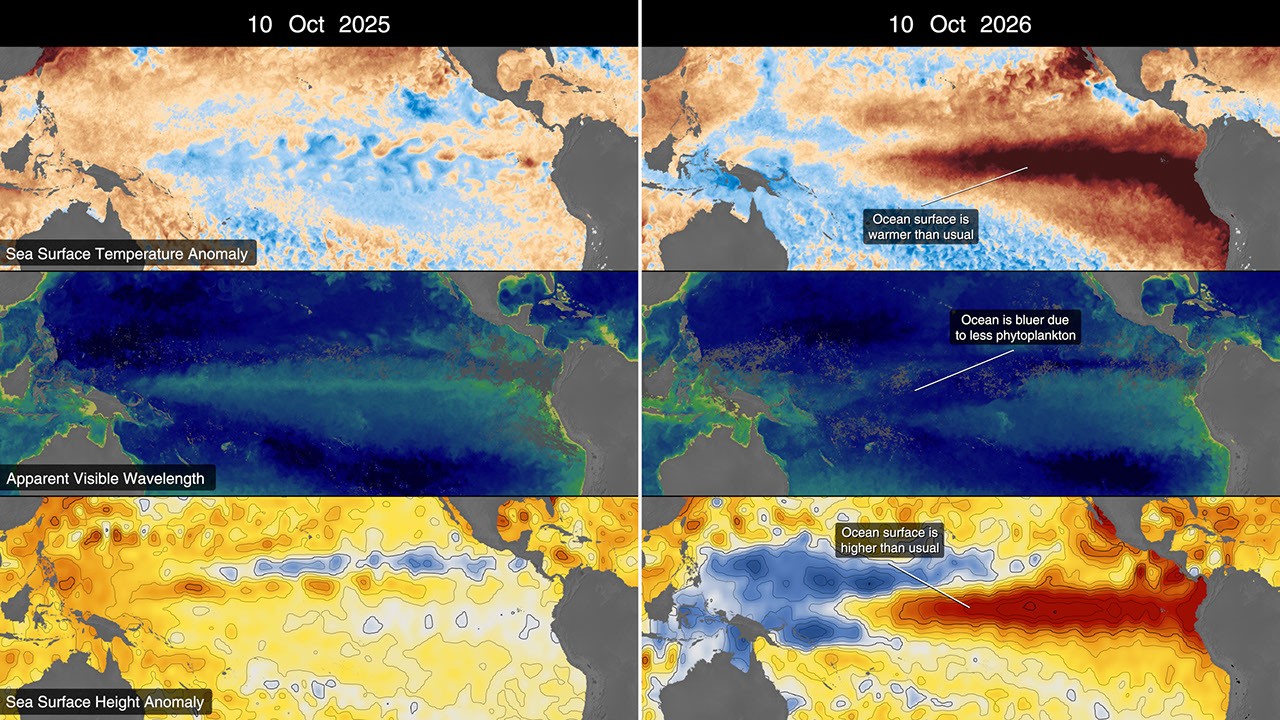
A phenomenon rarer than a solar eclipse and more powerful than any single storm system is unfolding this fall, and NASA is tracking it closely. 6 Min Read NASA Satellites Observe Historic 2026 El Niño This visualization compares three ocean data products, sea surface temperature anomaly, apparent visible wavelength, and sea surface height anomaly, over the same months in 2025 and 2026.
As of October, the National Oceanic and Atmospheric Administration (NOAA) has said that there’s an 83% chance that the strongest El Niño since 1950 is currently unfolding. The map was created using altimetry data from the Sentinel-6 satellites, which measure water height for the entire ocean every 10 days, down to fractions of an inch.
Credit: NASA’s Scientific Visualization Studio One of the first clues appeared in satellite imagery in January 2026, when a swell of warm water called a Kelvin wave was spotted near Micronesia in the western Pacific. Ocean gets bluer The map above compares Apparent Visible Wavelength from 2025 (a weak La Niña year) and 2026.
Apparent Visible Wavelength is a data product from NASA’s PACE satellite utilizing ocean color data from the Ocean Color Instrument. As of October, the National Oceanic and Atmospheric Administration (NOAA) has said that there's an 83% chance that the strongest El Niño since 1950 is currently unfolding.
Follow along with these maps as NASA tracks El Niño from its epicenter in the equatorial Pacific Ocean. One of the first clues appeared in satellite imagery in January 2026, when a swell of warm water called a Kelvin wave was spotted near Micronesia in the western Pacific.
And our sea level satellites let us peer into the ocean and watch every beat. ” Scientists have used satellite altimetry to track the height of the ocean with ultraprecision since 1993.



Fonte original: NASA News Releases